


Decoding Returns – Yeh Dil Maange More ! Part – II
In the first edition of Decoding Returns, we introduced Returns & got familiar with some statistical tools to measure them. We would now try to understand a few more attributes of Returns as to which form of Returns to be used When & Why, because ultimately it all boils down to the fact that in our quest for Yeh Dil Manage More, somewhere we have to strike a balance between Risk & Reward and act rational & unbiased.
A question invariably surfaces, Is it really required to break our heads over so many complexities? The answer is a Big YES, cause it greatly impacts our entire investment journey & the ultimate outcome. Various statistical tools to measure returns help with deciding whether an investment is right for a portfolio, based on individual goals, risk tolerance & Time horizon for investing. As it is rightly said, Investigate & Invest, rather than jumping into an investment decision only to conclude that its not our cup of tea or it doesn’t suit us….
We have considered some actual data points to explain how radically different is the picture when the returns are expressed in different formats for the same investment avenue. Let us check the following:
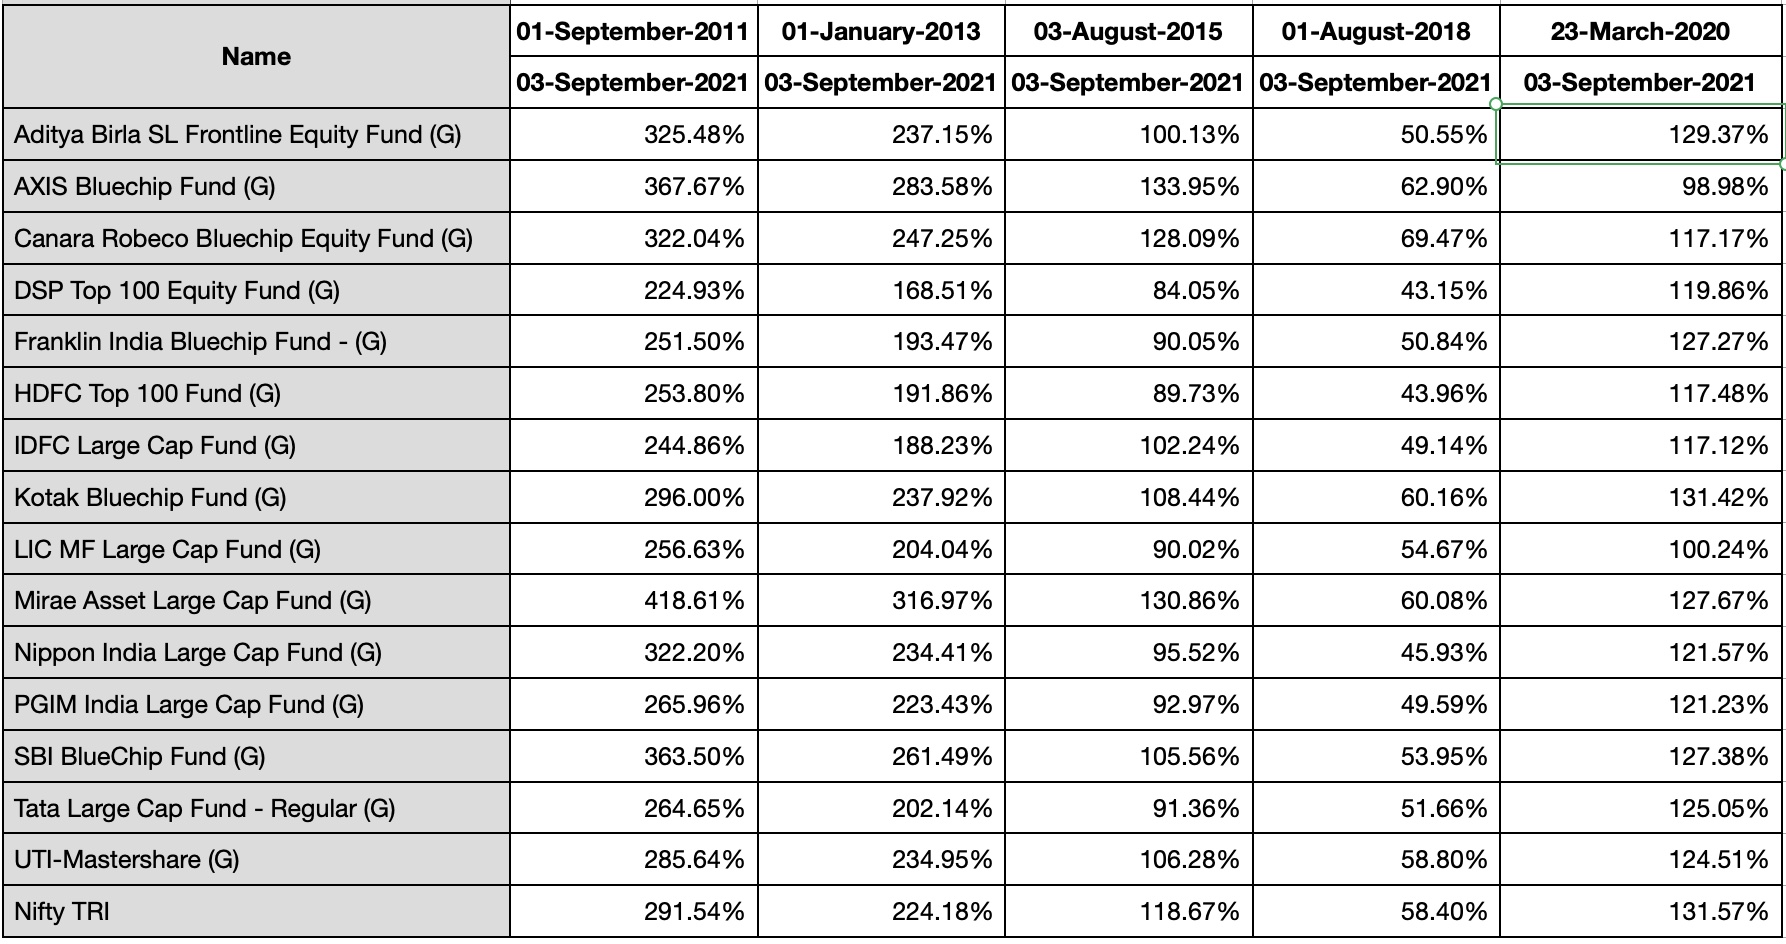
TABLE I – The Most popularly used representation of Returns

* Data Source from NGEN Markets & Morning Star AWS and Latest NAV Taken as on 3rd Sept 2021
As can be seen from the above table, we have taken returns data for Large Cap Mutual Fund schemes for the last 10 years. This is the most widely used expression of Returns & is known as Point 2 Point Returns, which is absolute or annualized (CAGR) returns calculated between two points of time. For example: if a scheme’s NAV on the 1st of January is Rs. 100 and on the 31st of December is Rs. 110, your annual return shall be Rs 10 or 10%.
Table – 2 POINT to POINT RETURNS – ANNUALIZED NUMBERS

* Data Source from NGEN Markets & Morning Star AWS and Latest NAV Taken as on 3rd Sept 2021
Table – 3 POINT 2 POINT RETURNS- ABSOLUTE NUMBERS
* Data Source from NGEN Markets & Morning Star AWS and Latest NAV Taken as on 3rd Sept 2021
While Table 2 above shows the Absolute Returns, Table 3 gives the Annualized Returns for different durations over the 10 year period. Point 2 Point Returns are nothing but snapshots of returns for a period to date (from today to past 12/24/36 months etc.) So, if Mr. A is lucky enough to start investing at the lows, his numbers would be significantly different from Mr. B entering at say relatively higher levels. The investment is in the same scheme, but because it shows returns on a particular point to date, it could bias our decisions. This analysis cannot tell you the consistency of performance of a particular investment.
Rolling returns, on the other hand, are average returns over several specific periods across an investment horizon. They are useful for examining the behavior of returns for holding periods, meaning thereby that they show the frequency & magnitude of an investment stronger & poorer periods of performance. They give a more accurate picture than a single snapshot of one period. Table 3 below shows the Rolling Returns data for the same set of schemes with Daily Rolling frequency for a holding period of 3 years (780 days @ 260 working days per year) over a 10 year time period
TABLE 4 – ROLLING RETURNS – ABSOLUTE NUMBERS
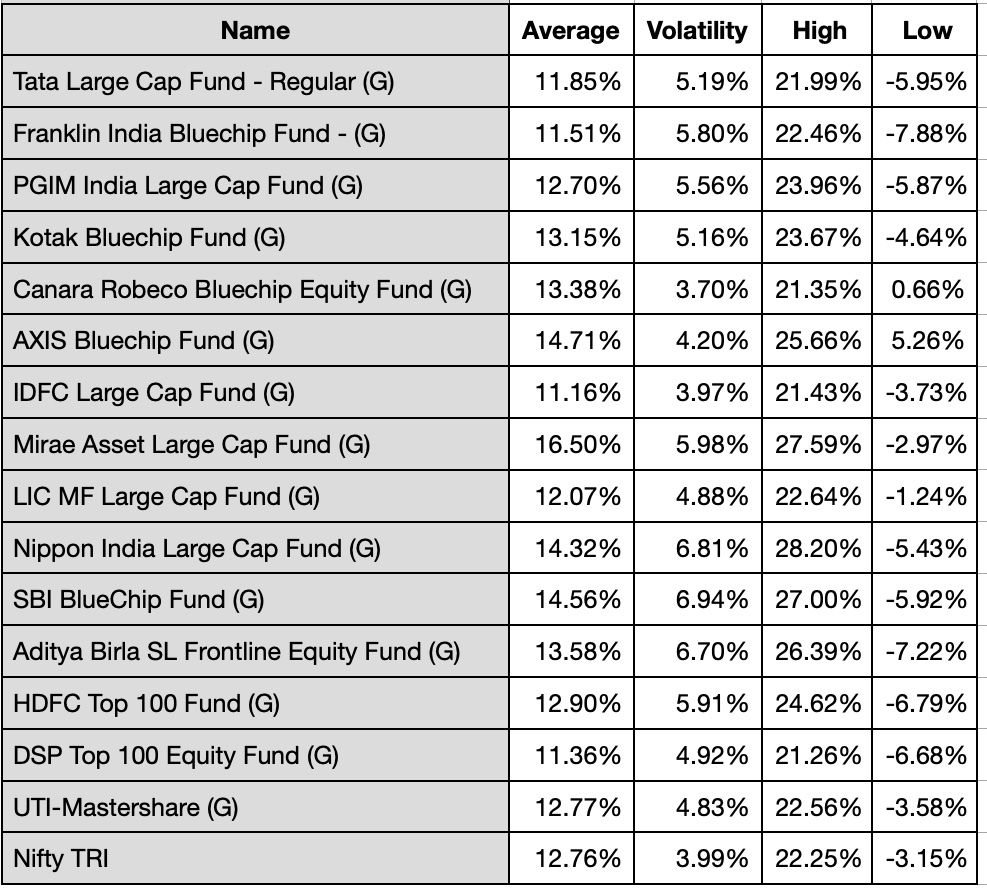
* Data Source from NGEN Markets & Morning Star AWS and Latest NAV Taken as on 3rd Sept 2021
TABLE 5 – ROLLING RETURNS- ANNUALIZED NUMBER
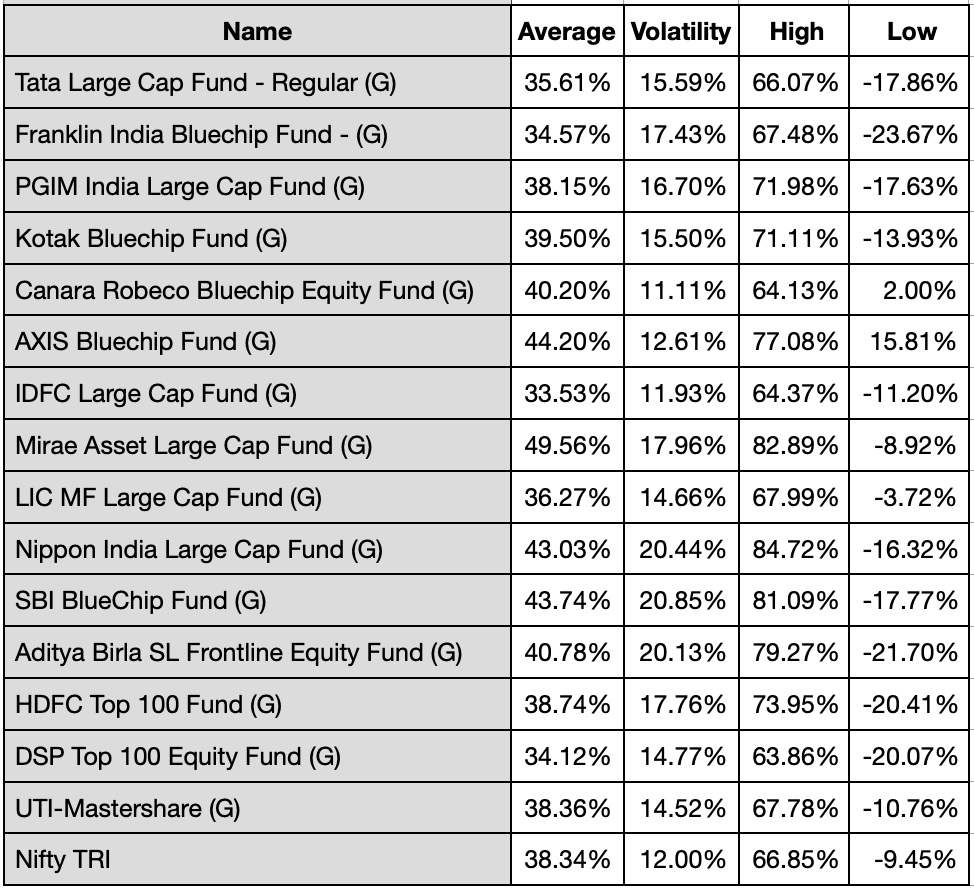
* Data Source from NGEN Markets & Morning Star AWS and Latest NAV Taken as on 3rd Sept 2021
As we can see, Rolling Returns show the best, the worst, the averages & the extent of variation from average, thus normalizing the extreme return situations. While mere numbers, absolute or CAGR could sway & impact our decisions based on the most recent performance, a slightly deeper dive into periodic averages give us clarity of the associated risks in terms of volatility of Returns & overall time-wise performance to take an informed decision suitable to individual risk profiles. Hence, it makes sense to do this little bit of homework before committing our hard-earned money.
Happy Investing!
Team @ MintBox Advisory
DISCLAIMER: PLEASE NOTE, THE ABOVE NOTE IS FOR INFORMATION PURPOSES ONLY AND SHOULD NOT BE CONSTRUED AS INVESTMENT, TAXATION, AND/OR LEGAL ADVICE. MUTUAL FUND INVESTMENTS ARE SUBJECT TO MARKET RISKS, READ ALL SCHEME-RELATED DOCUMENTS CAREFULLY.